Protea Atlas Logo
  Home
  Mission
  Overview of Project
  Project Staff
  Sponsors
  Achievements
  Checking, Illustrations
  Upcoming Activities
  Id and  Species Lists
  Protea Information
  Protea Gallery
  Growing Proteas
  Interim Dist. Maps
  Publications
  Afrikaanse Inligting

  SANBI

First Previous Next Last 

CONSERVATION IMPLICATIONS OF THE ATLAS DATA

What do these results mean?

Are they of any practical use?

Have we achieved anything concrete?

One way is to see what these results mean to conservation planning. We have some conservation planning tools into which one can feed the Protea Atlas Project data. (You can play on Worldmap too, and run the simulations discussed below).

What interests us is the conservation implications BEFORE and AFTER the Protea Atlas Project!

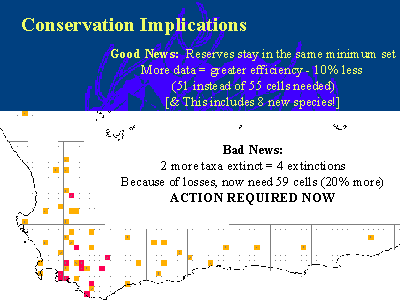
If we determine the optimum configuration of nature reserves to conserve every protea at least in one reserve we find the following:

  • The minimum set has not changed. Although the reserves are not always in exactly the same place, they remain within the same area of choice (a reserve is not confined to a single cell as show, but sometimes several equally suitable options for siting a reserve to conserve a set of species exists). This has profound implications. It means that we did not need all the invaluable Protea Atlas Project data to design an efficient reserve network. The exisiting data are good enough. In other words: Stop procrastinating. Stop wanting more data before taking action. Stop making endless new plans. Stop delaying and swithering - what we have is good enough! Get conserving now!

  • Efficiency has increased. Although the pattern has not changed when we added the Protea Atlas Project data, the finer details have. Remember we have 10 times the data and 8 extra species. Interestingly, the number of Grid Squares that we need drops from 55 GS for the pre-atlas data to 51 GS - an efficiency of almost 10%. Why? Becuase of all the new data for common species that has increased the number of potential sites (options) available to efficiently conserve the species. Remember that 5 of our new species only occur in a single Grid Square - fortunately these Grid Squares are in areas of high species richness so that they do not profoundly change where nature reserves should be located. And the new species that occurred in poor areas were widespread and so could be conserved in already identified areas.

  • Action is required - we are loosing our jewels! If we consider only the data collected by atlassers, then we get a shock. Not only do we need more than 51 GS, we need more than 55 GS. In fact, we need 59 GS to conserve all our species. This is 20% more than the ideal! Why? Because as species go locally extinct, our options forclose. We need to mop up more rare species! We need to obtain more areas (and more expensive areas) to do this. And remember this data does not include the four species (Leucadendron spirale, Ld grandiflorum, Se aemula congesta and Se furcellata) that are now extinct and thus unsaveable! What this means is that every delay, every lost opportunity makes conserving what is left more difficult, more expensive, more impossible. We need action. We need action now. Tomorrow is too late.

Enough bad news - are you sure that you want more?

Slide 18 of 24